Do Long Technical Posts Work?
Do people actually read them in their entirety? How much do they engage with the content? Do they often return?
In this post, we'll start to get initial insights via an n=1 review of a front page HackerNews post's engagement metrics and see how it performed across time.
Published on 18/12/2025 • ⏱️ < 5 min read
On any given week in online programmer(-adjacent) circles, you'll find long technical blog posts sharing an insight/prediction/review that took a non-trivial amount of effort, experience, thought or research to arrive at. In the best case for a reader, this is great - an opportunity for huge information gain at minimal cost! Obviously, this varies and becoming a well-calibrated reader that maximises information gain per unit time across an extended period is an art unto itself.
For what regards my last post that got to the front page of HackerNews, did I succeed in providing that core desirable insight that the readers deemed it worthy enough to pay the full minimal cost? Readers had mostly positive things to say but to exclusively derive insights from those sources would be fraught with bias.
Other than for that short time, I'm often on the reader's side of the page and often wondered - what even is the reach and impact of these types of posts? Do people actually read them or are they more akin to George Orwell's 1984?
Insights
In order to get a rough first approximation1, I went with the simplest thing and started with tracking the scroll depth % of readers and defined Completion Rate as a crude "reached 80-85% of page length". Importantly, 1) the analytics respect user privacy and 2) events don't re-trigger if a reader jumps to and from different sections2.
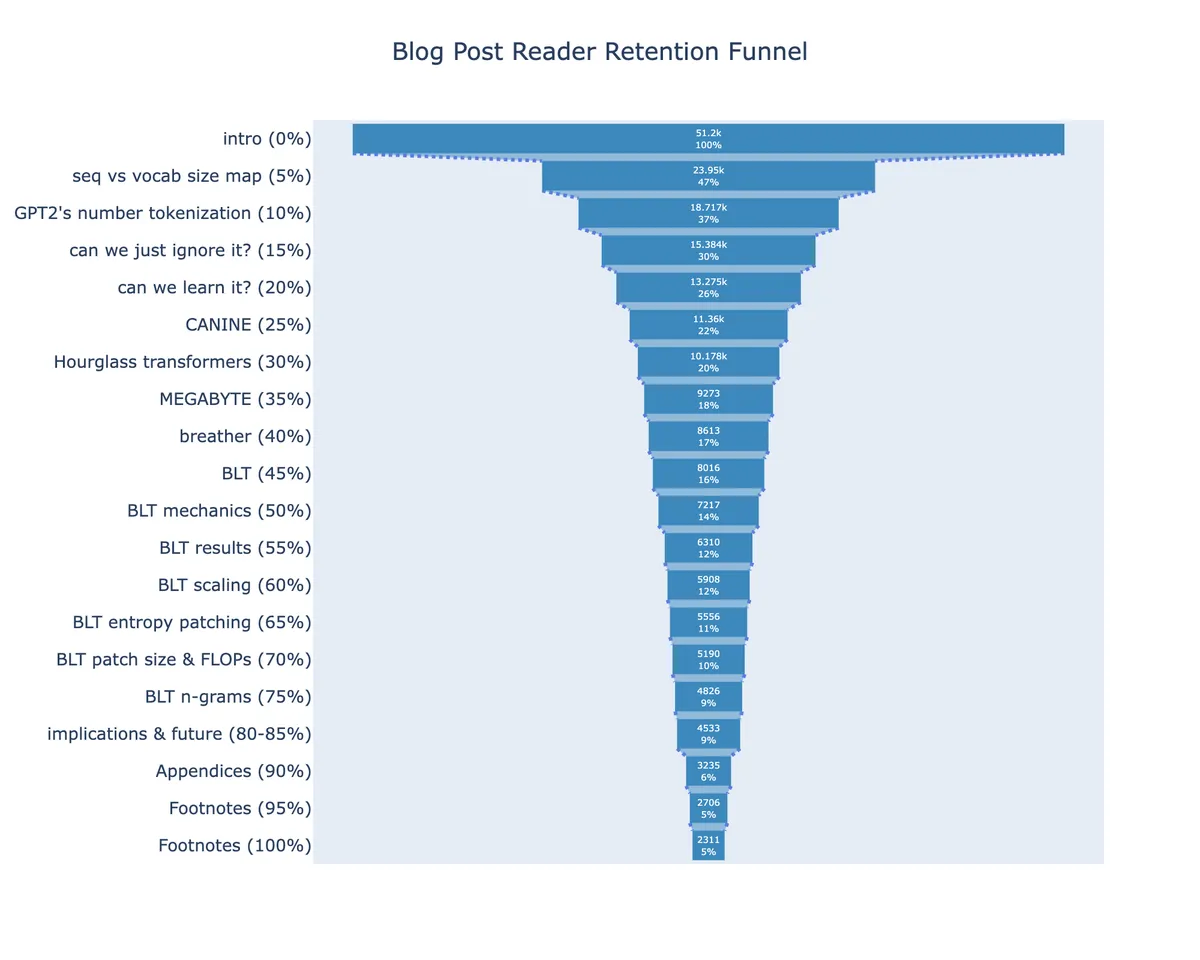
From this chart and more, we can observe the following:
- Largest Drop-off within first 5%
- before even getting through the "problem statement", ~53% have stopped reading
- First Quarter Attrition
- by the time the 25% mark is reached, more than 75% of readers have already left
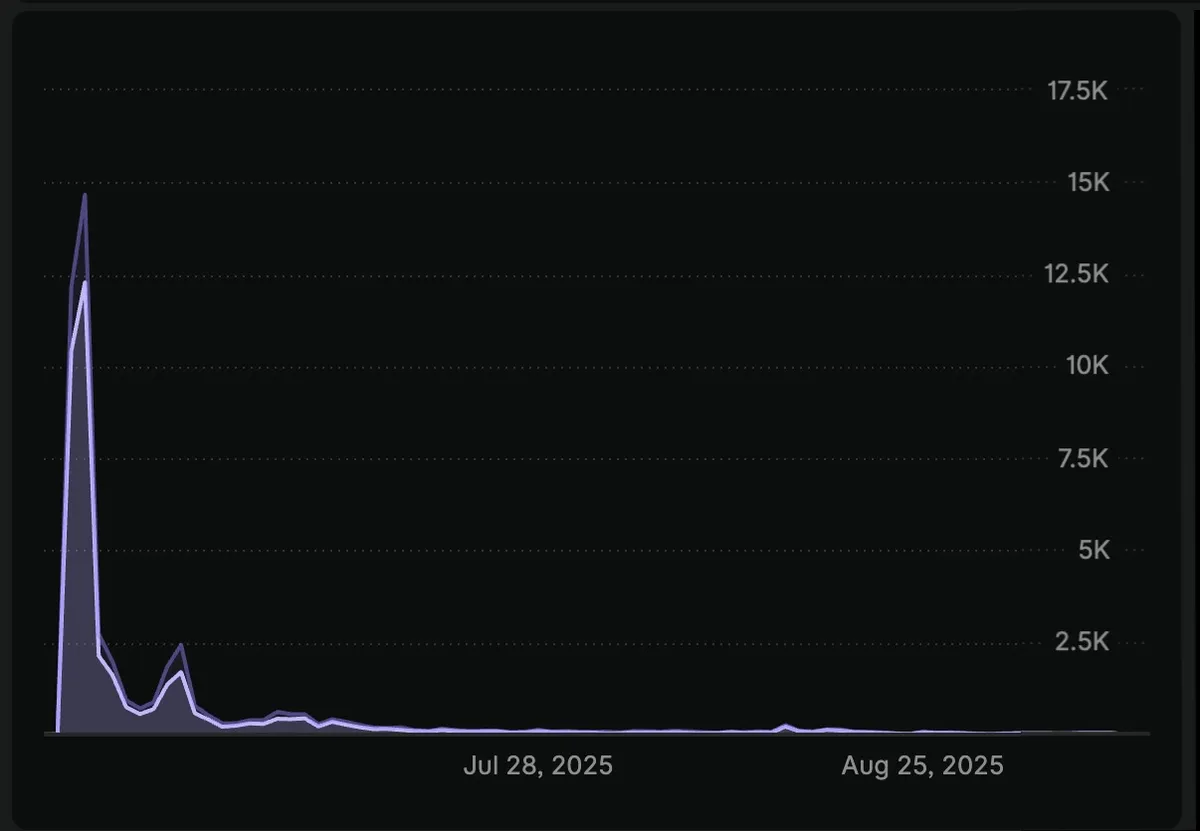
- Repeat visitors
- ~19% of page views were return readers3 but we'd probably expect this to be higher on more evergreen posts
- Optimistic Completion Rate
- ~9% of readers end up finishing the post
An obvious disclaimer - these insights are, as with anything n=1, fragile and should be held weakly with anticipation of more (diverse) data.
Moving on... If we plot the page views over time, we can see:
Given that I didn't pay much attention to the path in which readers got to completion, the insights have to come with disclaimers w.r.t inflated completion rates:
- I didn't track footnote clicks that auto scroll to the bottom (analytics events will still trigger)
- I didn't track scroll rates over time when people scroll all the way to the bottom
We can't know the extent of the completion rate inflation and so if we take the pessimistic case4, we can assume that all of the readers that got to the 100% completion were in fact false completions (i.e -5%). In that case:
the true completion rate for web readers is anywhere between 4% and 9%5
The large error bar on this completion rate isn't ideal but that's what you get when your hard deadline is a train to a 5 day offline trip6 after optimistically scheduling an almost-there blog post to a, seemingly, 0 audience blog and then finding it on the HN front page (h/t to todsacerdoti) after 2 hours.
If we consider that all the metrics are conditioned on readers that were interested from the blog post title, we can derive some additional handy insights for the motivated author:
- HN traffic >> relevant subreddits (even at similar upvote counts)
- Mobile > desktop (53% mobile, 47% desktop) so ensure that your posts are mobile optimized!
- Top 3 Geos (so think about your post times)
- 🇺🇸 - ~48%
- 🇬🇧 - ~8%
- 🇩🇪 - ~6%
Future
In the future, I'll consider extending these metrics by:
- tracking scroll rates to inform on:
- skipped sections
- full post-skippers
- tracking footnote clicks to:
- exclude from completion rates
- get additional insights as to the average reader's curiosity/rigour
I'd also like to augment the reading experience by:
- displaying click counts on supporting evidence
- tastefully informing the reader "you're now in the p75 of readers!" as they read
I haven't seen the latter tried before and it might just be because it's a bad idea but the only way to know is to try!

Footnotes
By only considering web readers and not those who would use clippers.↩
and 3) completion rate isn't "comprehensive" in that it would require readers to go from start to end in it's entirety (in a single or across sessions) so people that skip sections due to prior knowledge or due to an uninteresting section. They aren't captured here.↩
Either due to bookmarking or to revisit content (I would bet majority are the former)↩
Or optimistic - if people are reading the footnotes 😅↩
The floor could also be lower in that some readers might have scrolled just until the final insight and they would have appeared as a valid completion reader.↩
Real video footage of my rush to my train for Castle Cary↩